Monitoring Nifi with Data Dog
Monitoring your nifi deployment is almost as important as setting it all up. Knowing that your flow is performing as expected and that the data isn’t throwing errors, blocking queues, or causing other problems requires some ongoing tasks, be it daily checking nifi, or some sort of monitoring. Nifi has some built in reporting tasks which can be used for this, and one of them is a Datadog Reporting Task. This reports 25 different metrics about nifi and the JVM. Ranging from queued bytes to JVM garbage collection, plus more for each processor you have running in your flow, the overall stats are pretty useful. This post will walk through setting this up form start to finish.
If you haven’t signed up for Datadog, they offer a 30 day free trial, and you can then convert to their free tier after the trial period. Once signed up, there are two ways to report metrics, through an agent and via the API. Both are similar, but the agent can report host system metrics, disk IO, network IO, overall memory, etc, while the API is only nifi metrics. I went the path of the API since it’s more straight forward if you already have nifi installed. I could definitely see creating a dockerized installation with both the agent and nifi installed in a container to get those host metrics though.
Datadog initial setup
Datadog requires you setup a Datadog agent before being able to use the API key, and I went ahead and did the Docker agent since it’s probably the easiest way to get past this initial checkpoint. Once you run an agent, you can grab your API key from Integrations-> APIs on the left side, or top, menu in Datadog. There you can copy the initial key that they created for you, or create a new API key.
Nifi Reporting Task Configuration
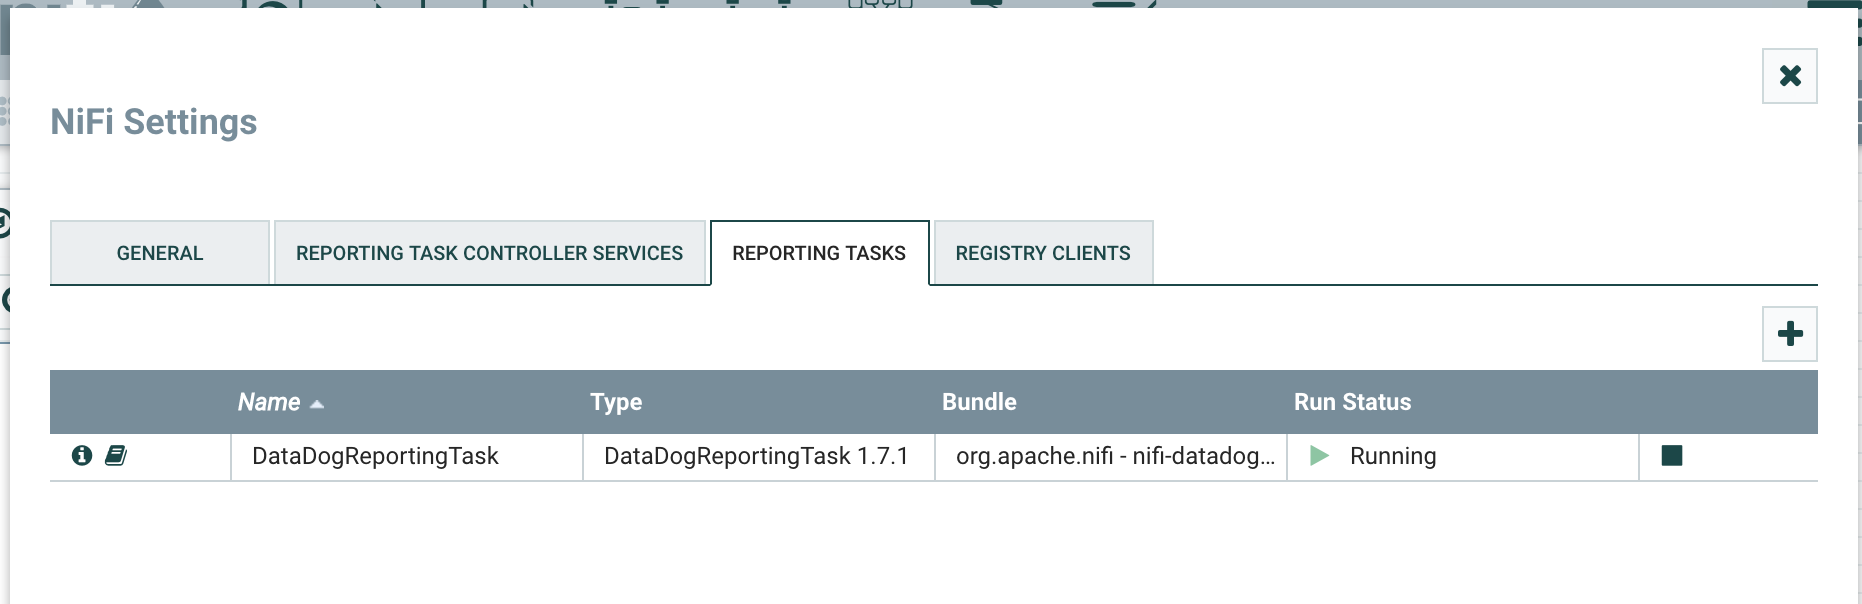
Once you have your key, it’s pretty straightforward from there. From the hamburger menu in nifi, open Controller Settings and then go to the third tab, Reporting Tasks. Add a reporting task, find the DataDogReportingTask, edit it and add in the the API key.
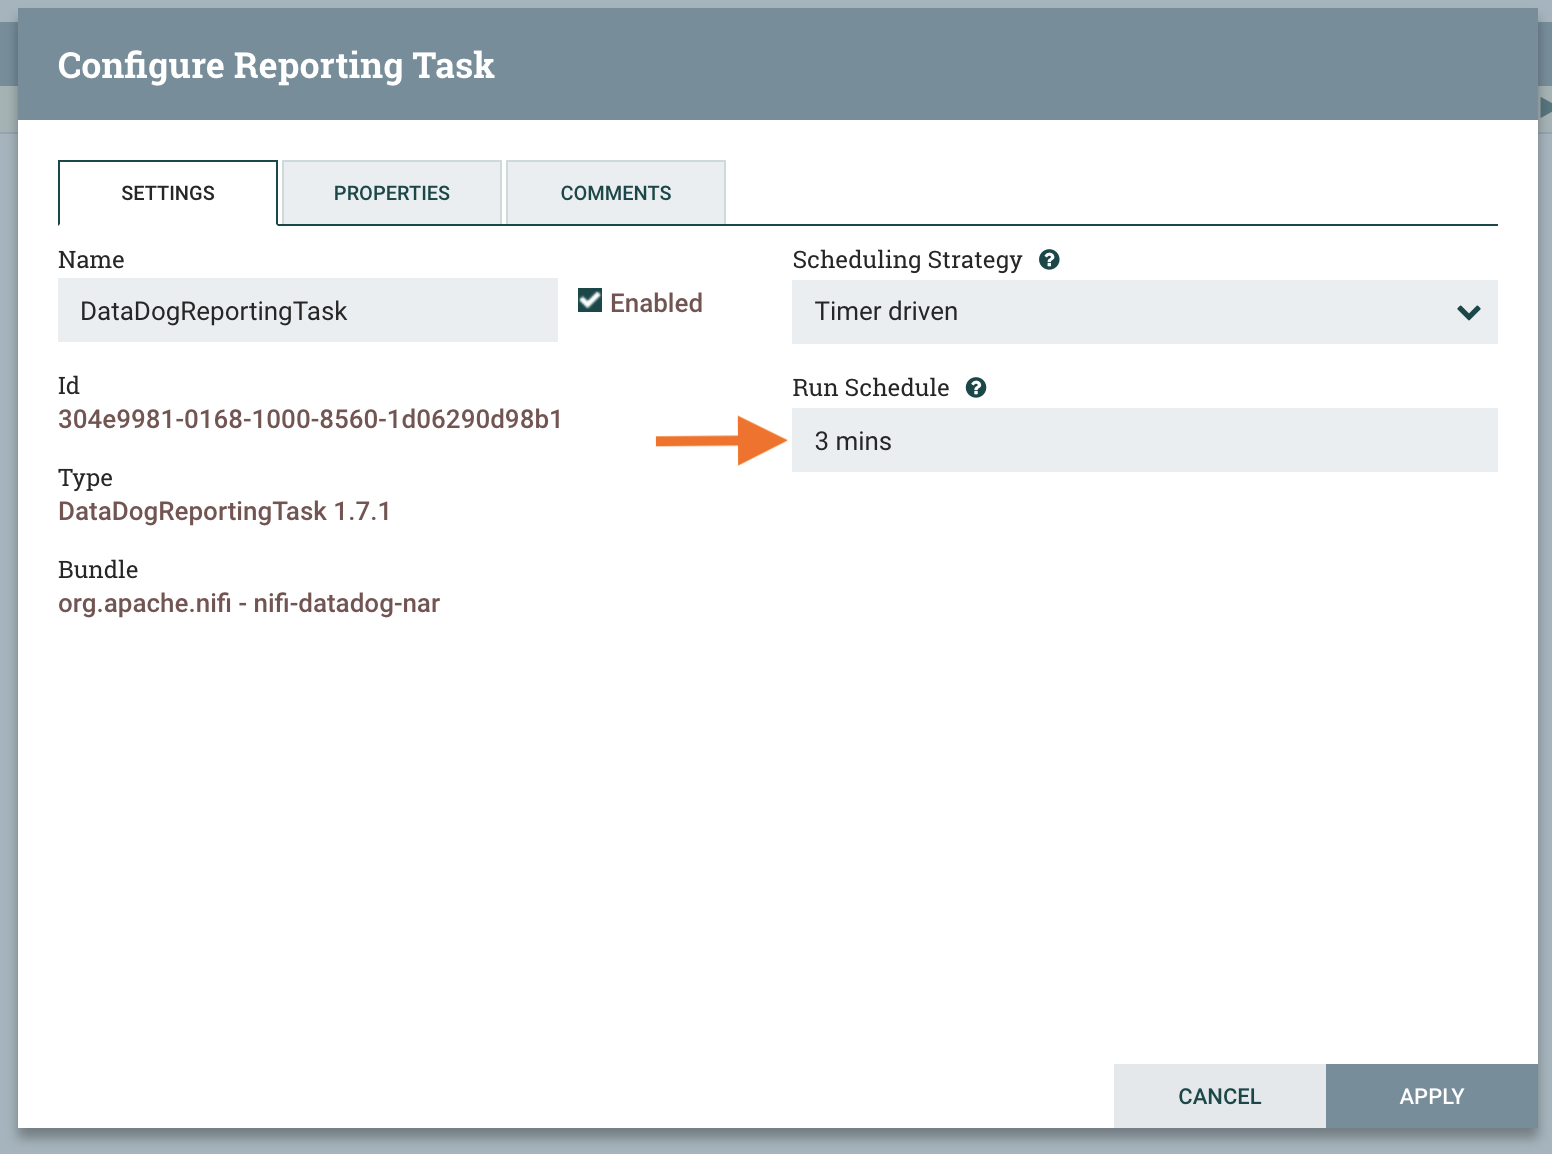
Reporting tasks are set to run evyer 5 minutes by default. To change this you can edit the Run Schedule under the Reporting Task settings tab.
Once saved, start the reporting task on the right side of the menu. If everything is working as expected, you shouldn’t see any errors in the bulletin and we can move on to viewing the reported metrics in Datadog!
Viewing Metrics in Datadog
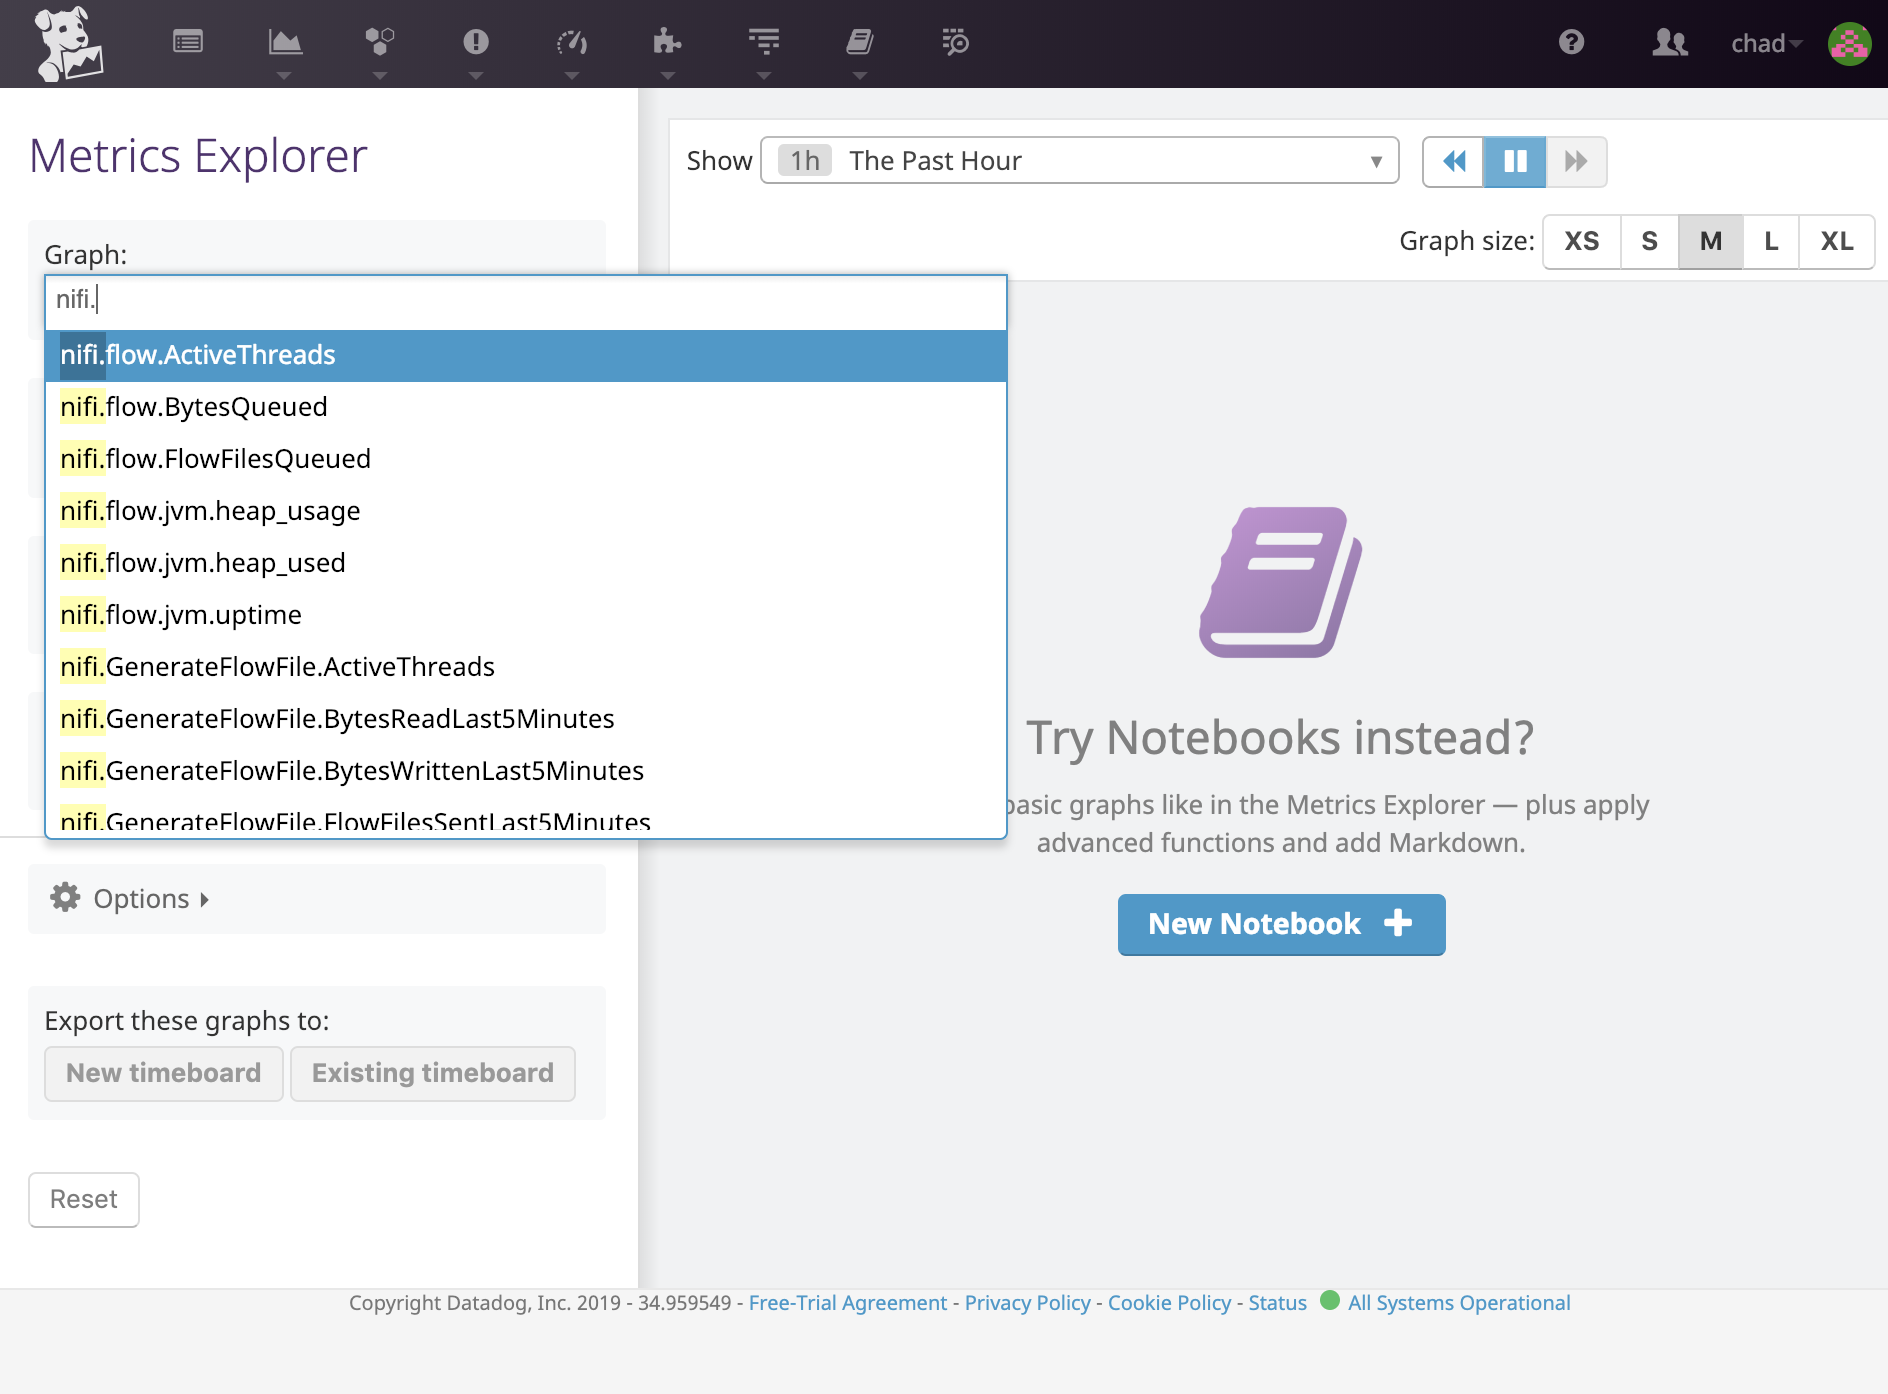
In Datadog, we can view the reported nifi metrics via the Metrics Explorer in Datadog. All metrics reported have a ‘nifi.’ prefix. Start typing in the Graph box and you can select the metrics from nifi that you want to see.
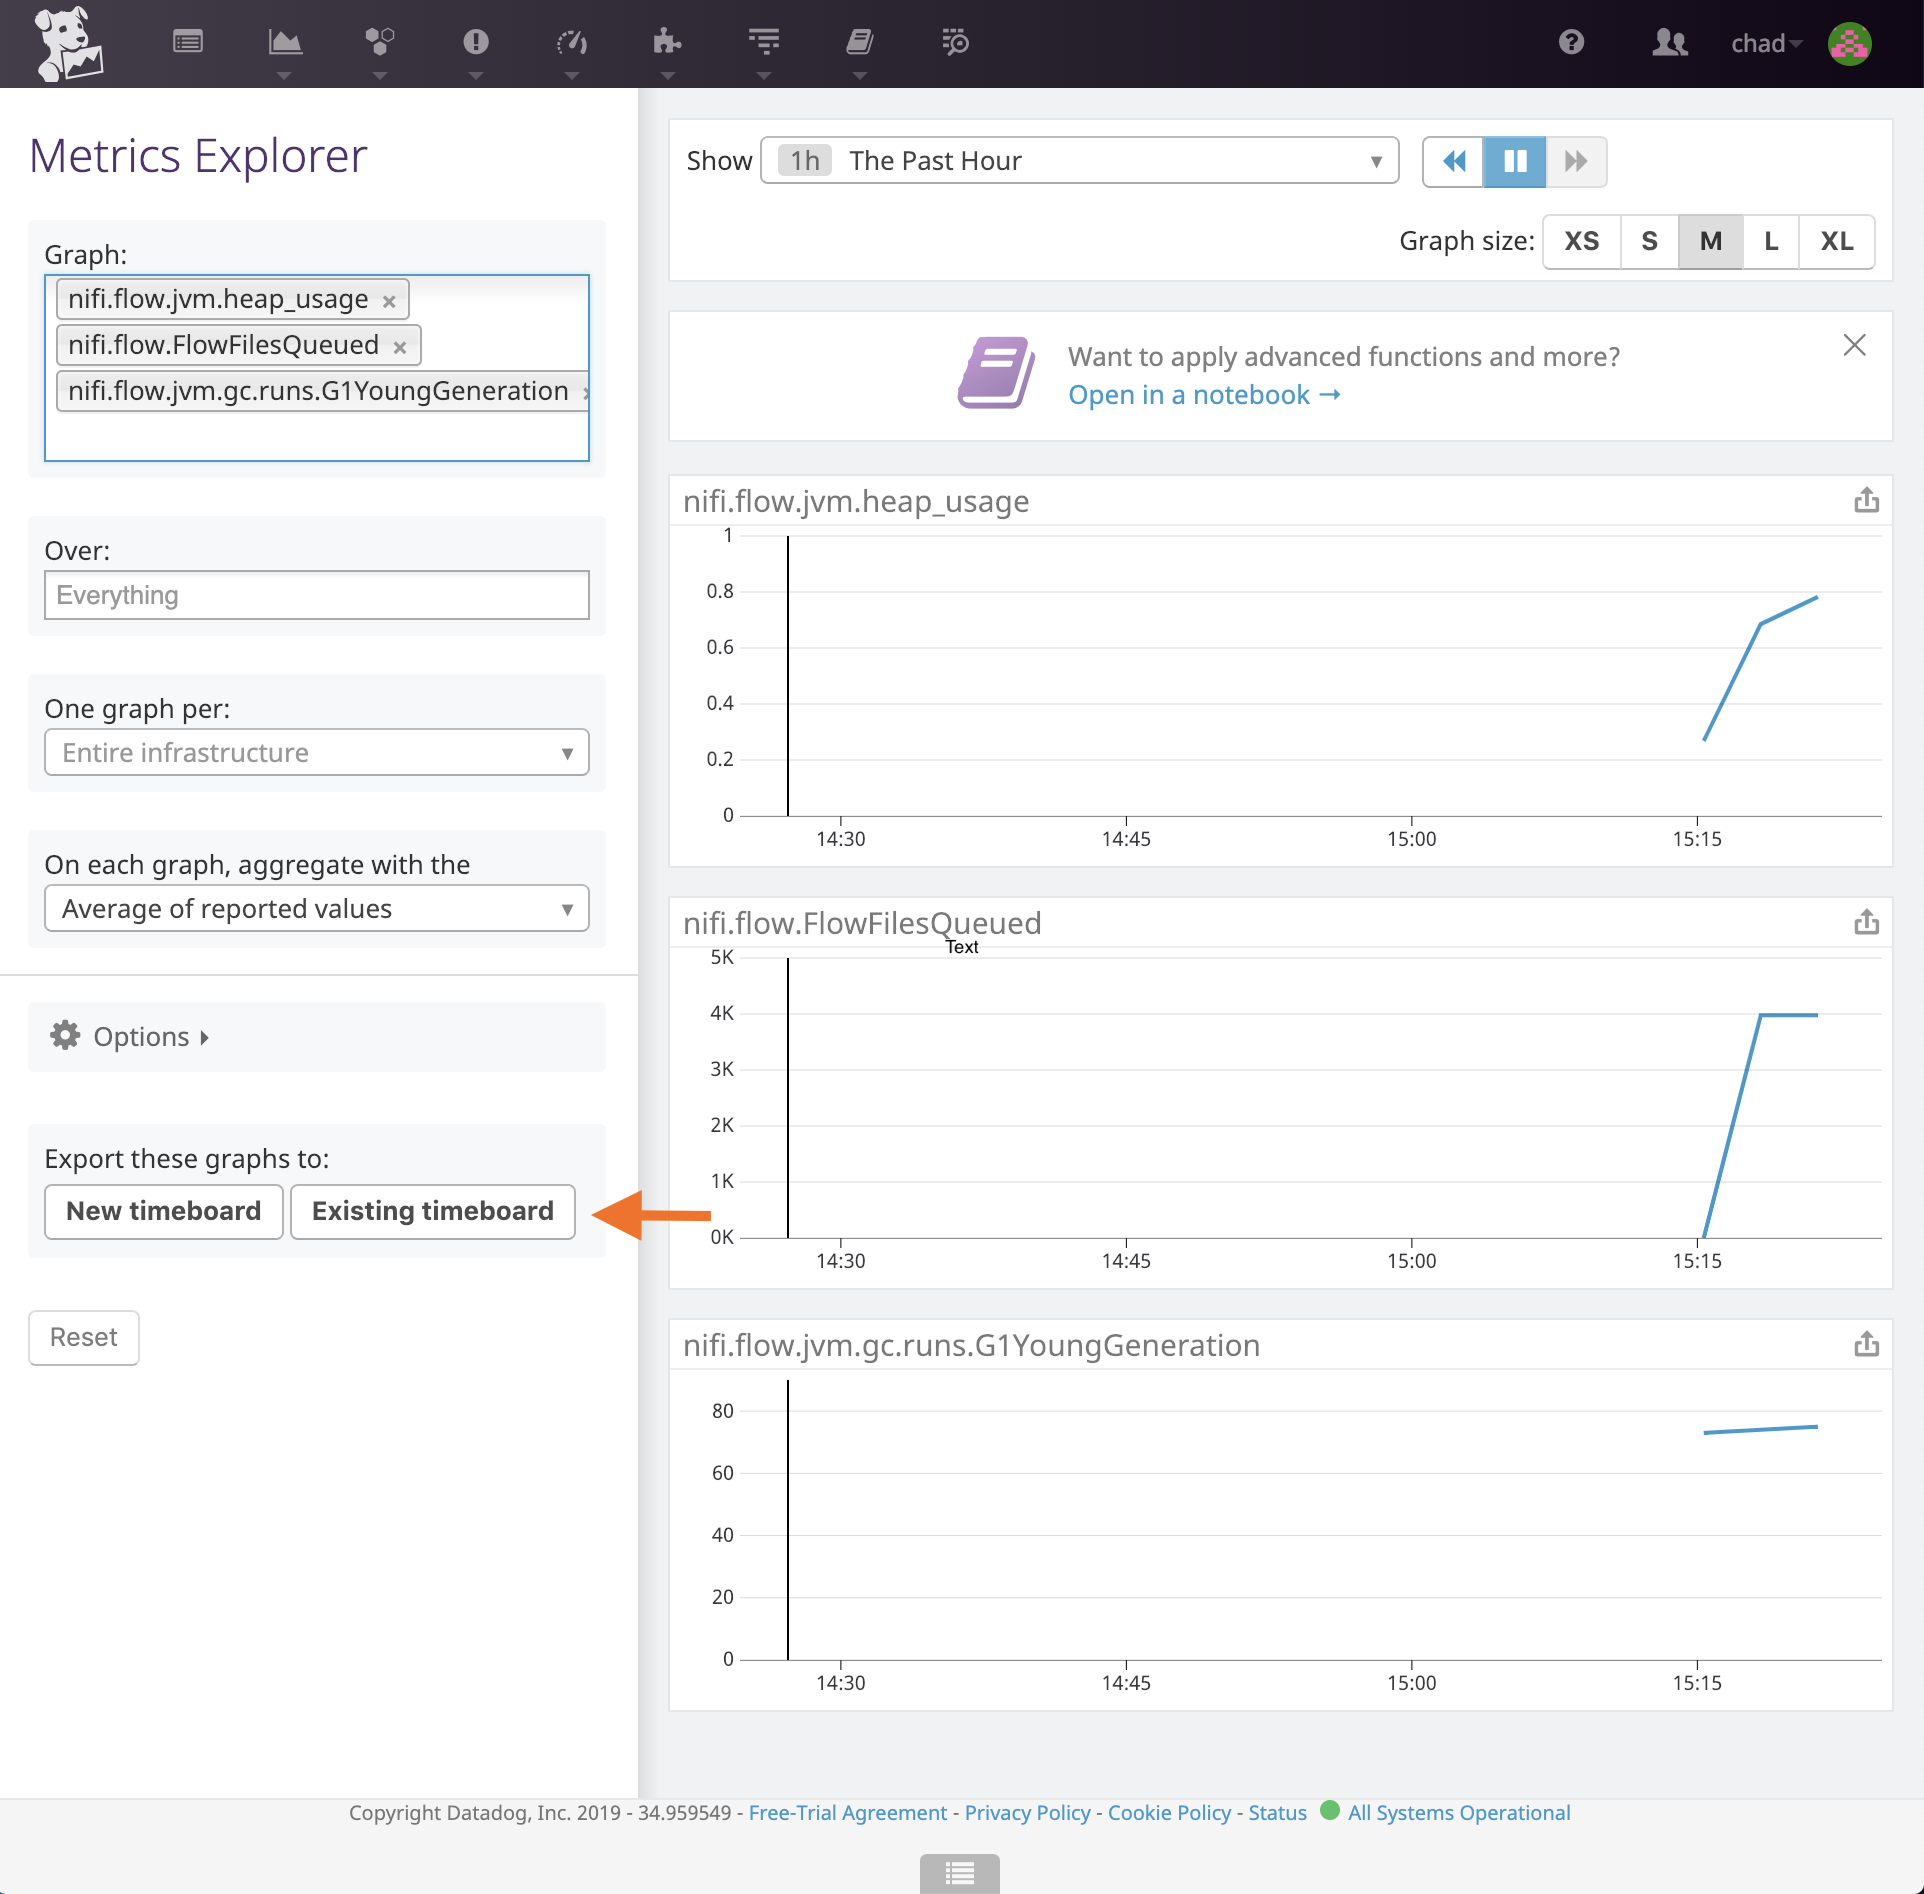
You can select multiple and the graphs will show up to the side. This is a quick and easy way to figure out what metrics are available and which are important based on your current flow. Once you have the views or metrics you want you can choose to save them into a Dashboard on the left side, “Export to timeboard”.
Once exported, you can access the new timeboard through the Dashboards menu in Datadog. Staring it will make it available in the dropdown immediately under “Starred Dashboards”.
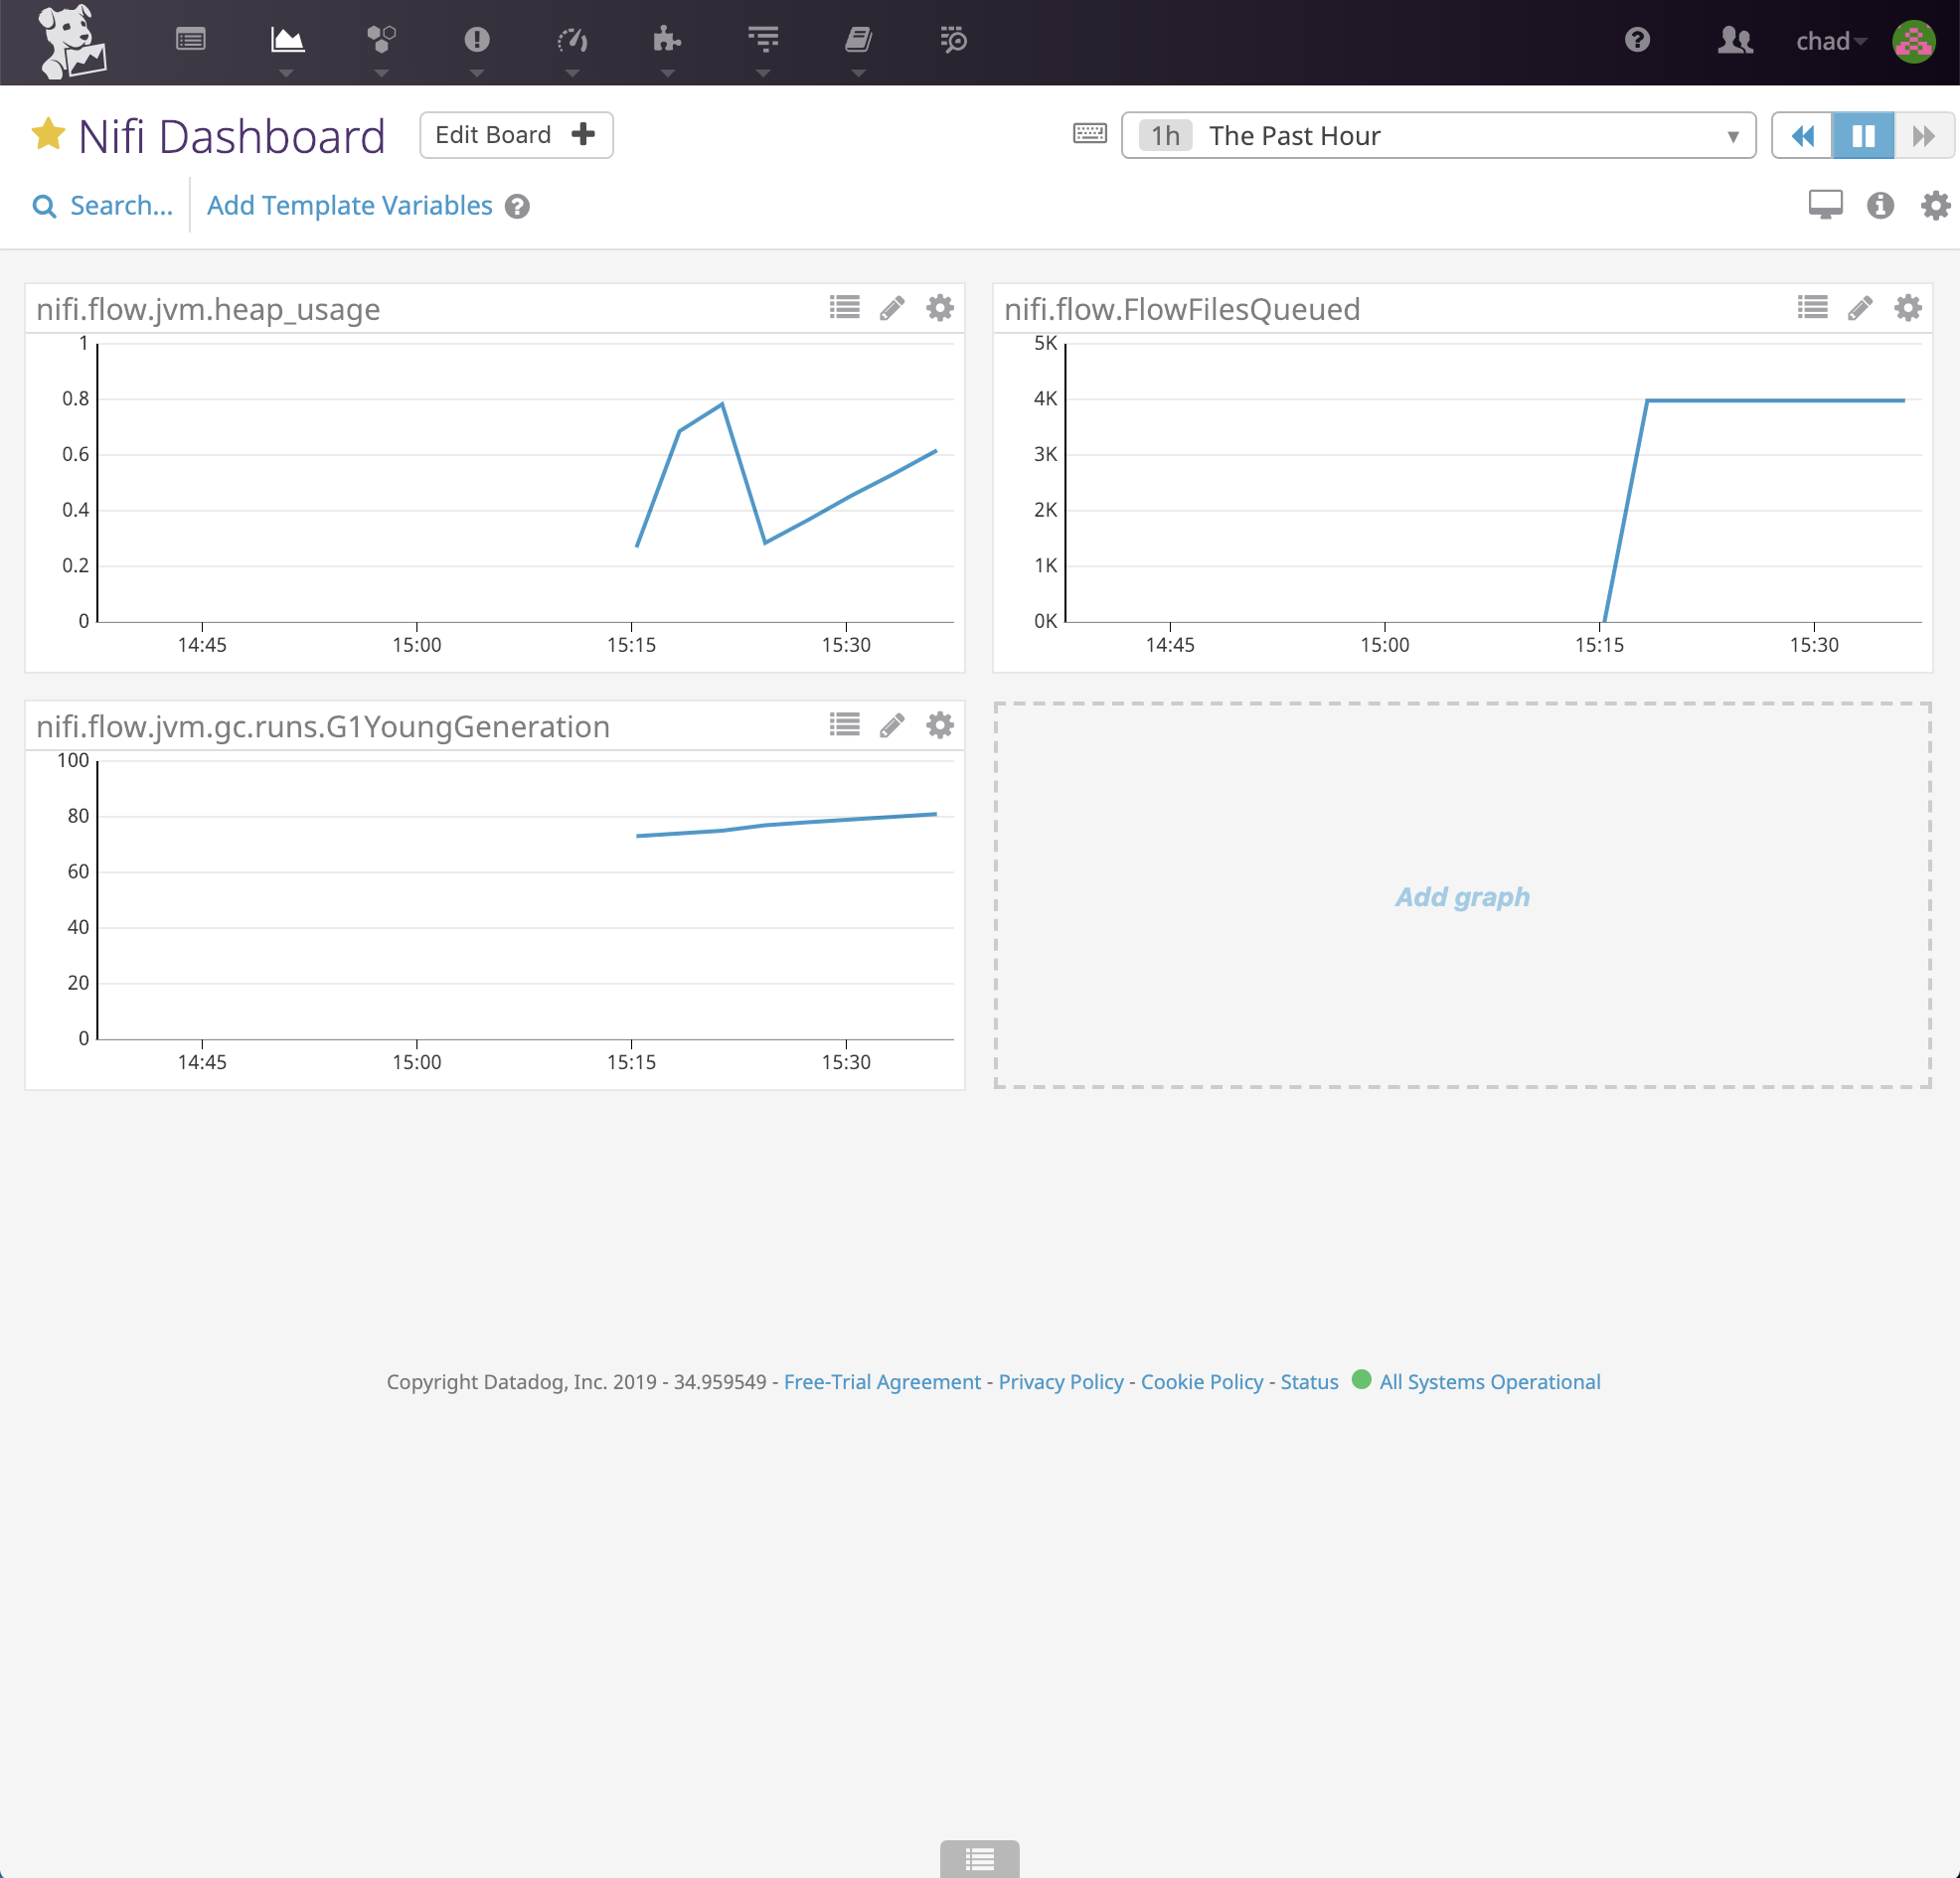
If you have any questions about using Datadog with nifi, or would like to see other options for collecting nifi metrics, let us know. We hope you found this post useful! If you need help with your dataflow, gathering metrics from nifi, or anything else nifi related, we would love to help! Just drop us a message on our contact page.